This Ending Creates a New Beginning

– From Information to Advocacy
If this series has done its job, it has moved the conversation a little farther away from vague frustration and a little closer to shared understanding. The research behind it makes a clear case: East Jefferson County’s housing challenges are not the result of a single cause or a temporary market swing, but of multiple reinforcing forces—rural density limits, delayed infrastructure, organized resistance to change, a market shaped by outside capital, and the diversion of housing into short-term rentals and second homes. That matters because advocacy works better when it targets systems rather than symptoms.
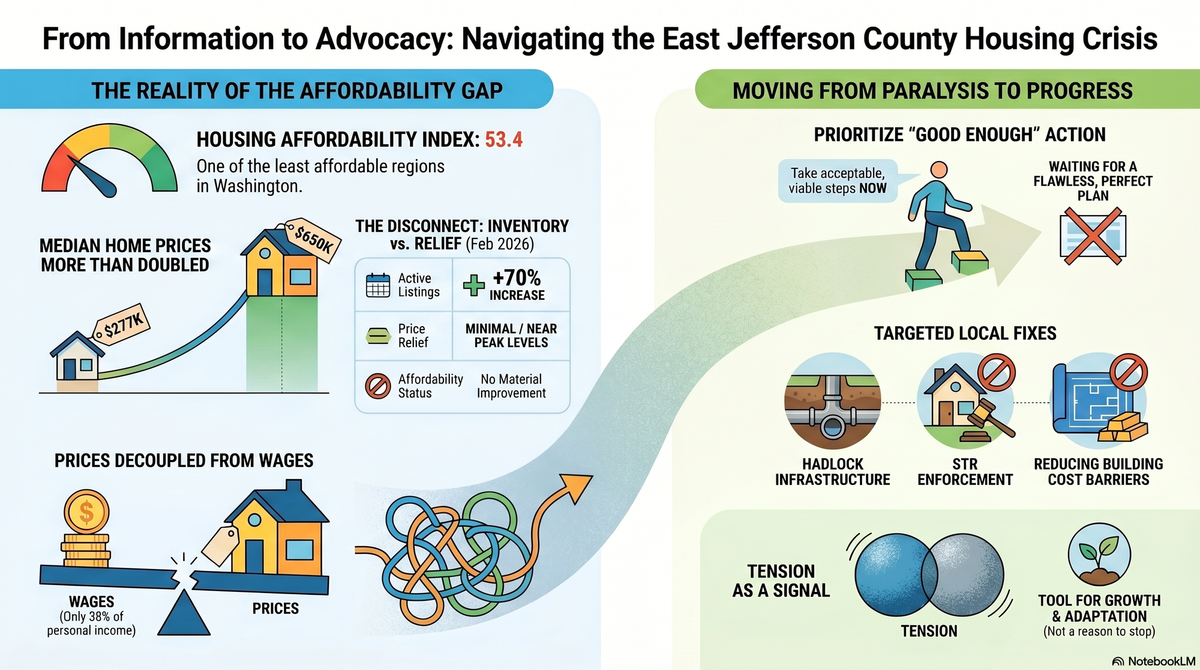
Information does not solve housing problems by itself, but it does enable better advocacy. When people understand that the county’s affordability index is 53.4, that prices roughly doubled from 2015 to 2025, that active listings surged more than 70 percent by February 2026 without producing major price relief, and that only 38 percent of personal income comes from wages, the conversation changes. It becomes harder to pretend this is just a matter of impatient buyers, greedy sellers, or one unpopular project on one street.
Sometimes “good enough” has to be good enough—at least as a place to begin. In a housing environment as strained and layered as ours, waiting for a perfect answer can become its own form of paralysis. The data shows East Jefferson County dealing with rising costs, uneven inventory, infrastructure delays, and a market where prices remain near peak levels even after a major inventory surge. In that kind of environment, progress depends less on finding a flawless plan and more on being nimble enough to adapt, honest enough to admit when something is not working, and open enough to keep moving toward something better.
Adapt, improvise, and overcome.
Tension Isn’t the Problem—What We Do With It Is
Lately, there has been a lot of reflection on the idea of tension.
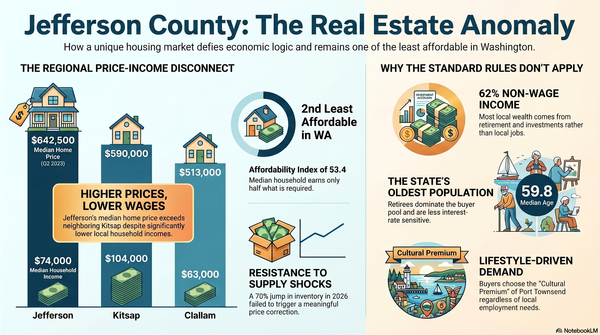
In housing—and really across the entire community—there is a lot of it right now. You can feel it in public meetings, in neighborhood conversations, and in the daily work of moving projects forward. That tension is not imaginary. The research shows a market pinned between prices local incomes cannot support and structural supply constraints that limit meaningful new housing. Median home prices in Jefferson County rose from about $277,000 in 2015 to about $650,000 in 2025, while the Housing Affordability Index fell to 53.4, making the county one of the least affordable in Washington.
Tension gets a bad reputation. Most of the time, people try to reduce it, smooth it over, or avoid it entirely. But tension is not always the problem.
Sometimes, it is a signal.
It tells us that something important has not yet been fully figured out: how to balance growth with livability, how to create housing without losing what makes this place special, how to make room for more people without dismissing legitimate concerns about infrastructure, scale, and community character. The data suggests East Jefferson County is no longer in a phase of pure scarcity, but it is not in anything close to a healthy equilibrium either. Inventory has risen sharply, but prices remain near their highs, and the underlying affordability gap has not materially improved.
That is why “good enough” matters. Not because standards should be lowered, but because communities rarely solve hard problems in a single elegant move. More often, they move forward by trying something viable, learning from it, correcting course, and building trust through action. A sewer phase gets funded. A housing tool gets tested. A regulation gets enforced. A policy gets refined after it collides with reality. That is not failure. That is how complex systems change.
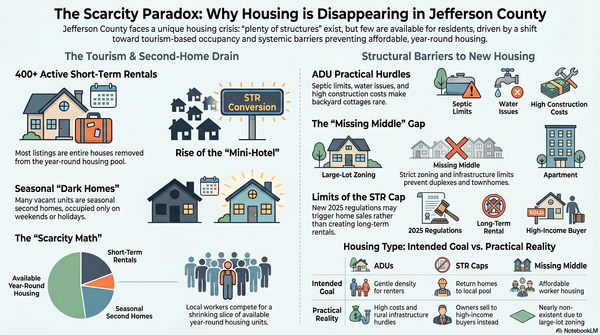
The research behind this series reinforces a central point: East Jefferson County’s housing constraints are layered and mutually reinforcing—rural density limits, delayed sewer infrastructure, high construction costs, outside capital, second homes, short-term rentals, and organized resistance to density. In a system like that, tension is inevitable. The question is not whether tension exists. The question is whether it becomes a reason to stop, or a reason to think more clearly and act more honestly.
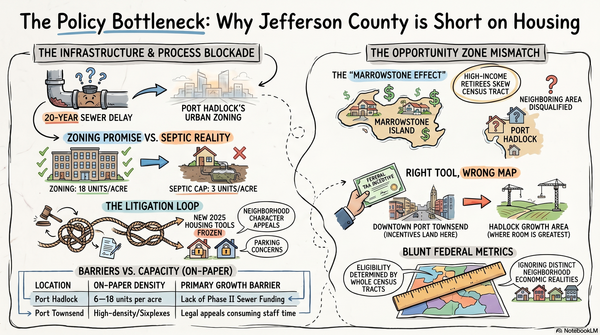
Sometimes, the most responsible thing a community can do is take an acceptable step rather than wait for a perfect one. The data points to several areas where action could matter: completing infrastructure in Port Hadlock, enforcing existing short-term rental rules, implementing affordability tools already on the books, and reducing cost barriers that make it difficult to build even modest housing. None of those moves solves the entire problem. But each one tests capacity, generates information, and gives the community a chance to learn what works—and what needs to change.
If East Jefferson County is going to make progress on housing, it will require less magical thinking and more adaptive capacity. That means being willing to begin before every disagreement is resolved, making room for experimentation, and accepting friction as part of public life.
Tension is not the enemy.
What matters is whether it leads to progress—or paralysis.
Thanks for sticking with me through this series—and for your patience while I climbed up on the occasional soapbox. I know I covered a lot of ground (and probably a few extra laps along the way), and I appreciate you staying with it.
I’m going to let this topic rest for a bit and shift my attention to some new directions. If you have thoughts on what you’d like to see next—or even what you think I got right or wrong along the way—I’d genuinely welcome the feedback. This conversation isn’t going anywhere, just taking a breather.
Primary Data Sources
NWMLS (Northwest Multiple Listing Service)
Annual statistical reviews, monthly market reports, and press releases for Jefferson County transaction data, inventory, days on market, and sale-to-list ratios. Used for: county-level median prices, inventory counts, closed sales totals, and the February 2026 year-over-year inventory change figure (+70.3% — the largest of any county in the NWMLS 27-county region).
WCRER (Washington Center for Real Estate Research)
Quarterly housing market reports, Housing Affordability Index, annual median prices, and inventory data. The Q2 2025 report is the primary source for the $642,500 county median, the HAI of 53.4, and the regional comparison table across Jefferson, Clallam, Kitsap, Island, and San Juan counties. Also used for the historical annual median price series (2015–2024). Jefferson County ranked second-least-affordable in Eastern Washington.
Redfin
Current listing data, submarket-level statistics, compete scores, and sale-to-list ratio trends. Used for Port Townsend 98368 submarket data (compete score 54–65/100), DOM comparisons, and the assertion that sellers are routinely accepting 2.5–3% below asking. Also used for waterfront property comparisons.
Zillow
Home value indices and submarket-level averages. Used for: Port Townsend median (~$634K), Port Hadlock average ($446K, zip 98339), Quilcene/Brinnon non-waterfront averages (~$362K), and waterfront lot price ranges. Zillow Home Value Index also consulted for broad trend confirmation.
Realtor.com / Beautifydata
Median days on market by county. Source for the February 2026 county-wide median DOM of 115 days (up from 74 days one year prior) and the Quilcene 98376 submarket median of 198 days.
Government and Planning Sources
Jefferson County 2025 Comprehensive Plan
Public review drafts (April 2025) for the Housing Element, Capital Facilities & Utilities Element, Economic Development Element, and Land Use Element. Primary source for: the county's 2020–2045 housing target of 4,119 units, the median home value doubling from $275K (2015) to $650K (2022), the formal 2017 housing emergency declaration, the jobs-to-housing ratio of 0.46, and Policy LU-P-1.3 on GMA incompatibility with rural housing needs.
Jefferson County Department of Community Development (DCD)
Permit timeline data, Site Development Review requirements, and project status reports. Source for permit processing timelines (averaging 161 days in 2023, improving to 76 days in 2025) and the Site Development Review add-on of 46–174 days.
City of Port Townsend Comprehensive Plan (2025 adoption)
Source for the Port Townsend UGA boundary history (unchanged since the early 1990s), the December 15, 2025 plan adoption, and the Caswell-Brown Village 32.72-acre UGA expansion. Also source context for the Evans Vista 14-acre city-owned housing site (in process since 2021).
Washington State Growth Management Act (RCW 36.70A)
Legislative text and MRSC guidance used to document rural density limits (1 unit per 5/10/20 acres), the prohibition on extending public sewer into rural areas, and the GMA's role in concentrating growth within UGAs. Applies to all counties in Eastern Washington and statewide.
Washington State Department of Commerce / HB 1220 Framework
Source for Jefferson County's 2045 housing allocation targets, the breakdown by AMI level, and Port Townsend's requirement to achieve a 550% increase in multifamily production. Also used for context on HB 1110 (middle housing), HB 1337 (ADU mandates), and SB 5148 (Housing Accountability Act / "builder's remedy").
Washington State Legislature Housing Report (December 2024)
Cited for the formal "Zoom town" designation applied to Port Townsend during the COVID-era analysis.
U.S. Census Bureau
American Community Survey (ACS) demographic data, building permit data, and QuickFacts. Key figures sourced: median household income ($74,048, 2024 ACS), total housing units (19,936 as of July 2024), median age (59.8), population 65+ (39.6%), children under 18 (11.5%), and 2024 building permit count (147). Also used for regional county comparisons (Clallam, Kitsap, Island, San Juan).
FRED / FHFA (Federal Housing Finance Agency)
All-Transactions House Price Index for Jefferson County (series ATNHPIUS53031A). Used to reconstruct the historical price trajectory back to 2007, including the pre-recession peak (~$337K), the 2008–2012 correction (–26.6%), and the recovery timeline.
Bureau of Economic Analysis (BEA)
Personal income components data for Jefferson County. Primary source for the finding that net earnings from employment represent only 38% of total personal income (vs. 64% statewide), and that investment income, retirement income, and transfer payments account for 62% of the local income base. Used to characterize Jefferson County as an externally-funded economy.
Bureau of Labor Statistics / Washington Employment Security Department
Covered employment figures (8,968 jobs), sector breakdown (government 27%, retail 12%, hospitality 12%), and major employer data including Jefferson Healthcare and Port Townsend Paper Company (300 jobs, $92,600 average salary).
Academic and Industry Research
AEI Housing Center
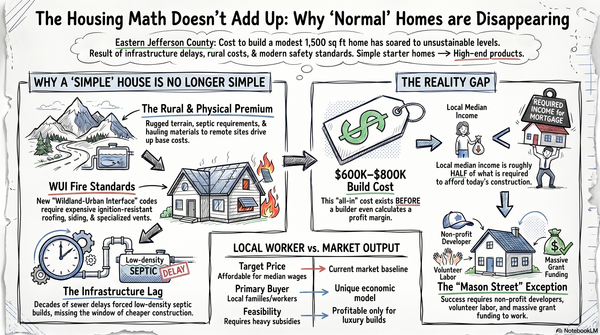
Port Townsend housing playbook and institutional ownership data. Source for the finding that only 2–3 new single-family detached homes were built annually in Port Townsend proper from 2014 to 2024, and the per-unit cost figure for the 2024 Admiralty Apartments ($351,726).
Freddie Mac Research (June 2022)
"Migration and the Housing Market" research note. Source for the documented threefold increase in net homebuyer migration from large metros to smaller communities during the pandemic period, supporting the Zoom town characterization of Jefferson County's COVID-era demand surge.
BIAW (Building Industry Association of Washington) — Housing Studies
Source for the Eastern Washington statewide average new construction cost of $309/sq ft. Used as the baseline against which Jefferson County's estimated premium ($375–$600+/sq ft) is measured.
AirDNA
Short-term rental market data for Jefferson County. Source for the count of 411 active STRs, the $17.5M annual revenue figure, and the 73%+ share that are entire homes removed from the year-round housing supply.
Local Journalism
Jefferson County Beacon
Local investigative journalism used throughout for: STR market coverage and the "rental market taken over by short-term rentals" reporting; the November–December 2025 comprehensive plan process (standing-room-only meetings, "gingerbread replica" incident, social media response); the AHPT appeal filing and its impact on 2026 city staff capacity; and Planning Commissioner Dylan Quarles's quoted statement on affordability irony. The Beacon is cited as the source of record for local planning politics throughout the policy section.
Peninsula Daily News
Coverage of planning commission meetings, the December 2025 comprehensive plan adoption, and the February 2026 AHPT appeal filing with the Growth Management Hearings Board.
Methodology Note
Monthly statistics in this market are subject to significant noise due to thin transaction volume (24–57 closings per month); quarterly and annual figures are more reliable indicators of trend. All dollar figures are nominal unless otherwise noted.
The forward-looking scenarios are probability-weighted assessments, not predictions. The market's small size, policy dependence, and demographic exposure make it inherently less predictable than larger, more liquid Eastern Washington markets.